
Modeling tips & tricks
Learn from our team of modeling experts and the decision analysis community on best practices for model building. Here you will find information about Analytica, as well as general tips and tricks. Topics include how to go about structuring a complex problem, how to analyze models using sensitivity and scenario analysis, and tips on selecting graphs and maps to provide clearer insights. Overall we want to guide you and your organization to be better decision makers, no matter what industry or field you work in.
For more a more comprehensive list of tutorials, user guides, videos, example models, and libraries, check out our Analytica Docs website.
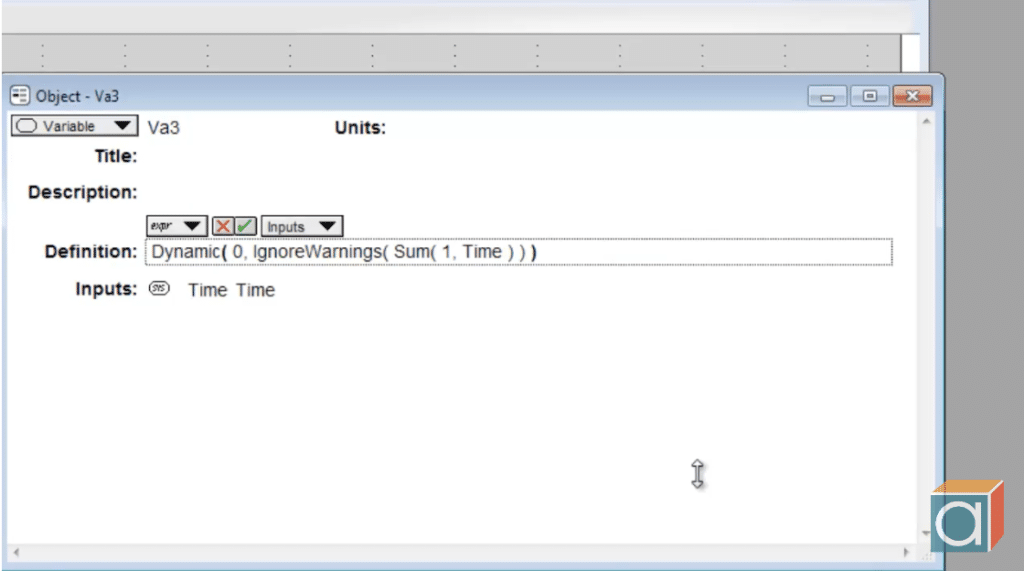
The length of an index
Finding the length of an index is obviously pretty trivial. But there are several ways to do find it, and there are some “gotchas” if you aren’t careful. The IndexLength function...
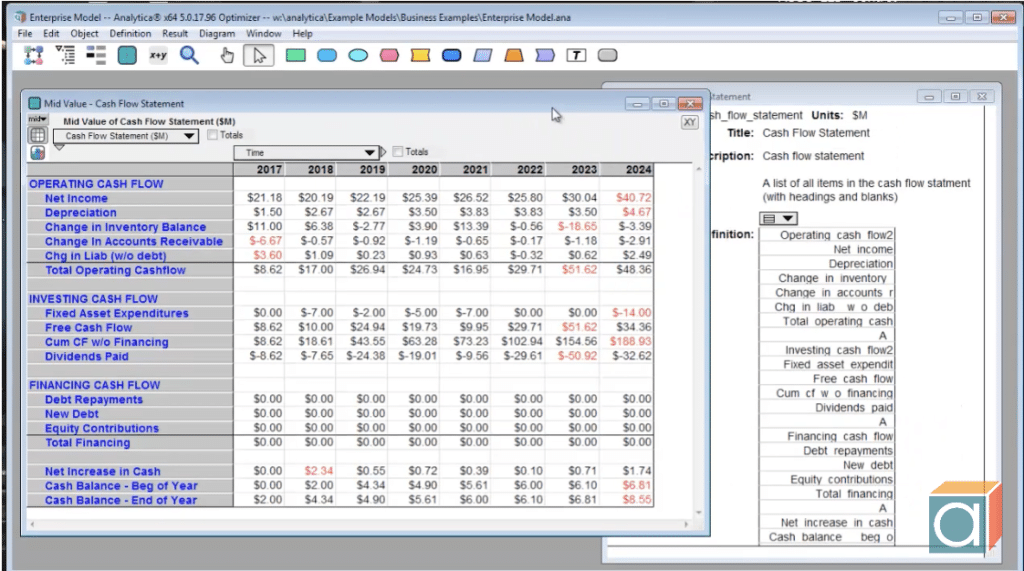
Analytica 5 video short: How to display negative numbers in red
The Analytica 5 Video shorts series — short (under 5 minutes) videos showcasing an individual topic or feature in Analytica. The series primarily focuses on features that ...
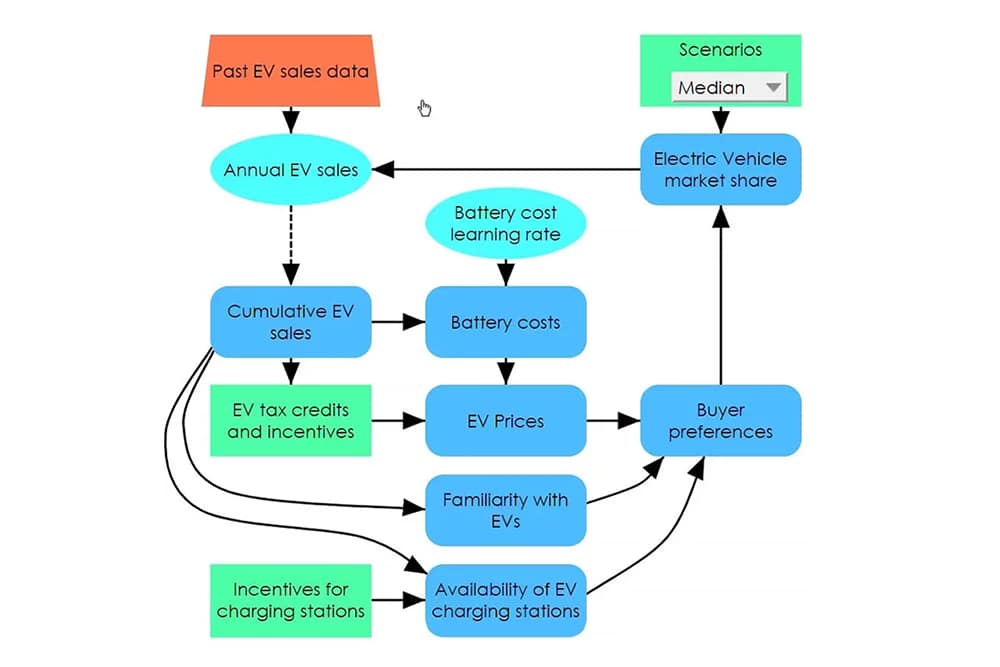
How to draw an influence diagram in 3 minutes
Learn to visualize decision-making and boost your analytical skills with this guide on drawing influence diagrams.
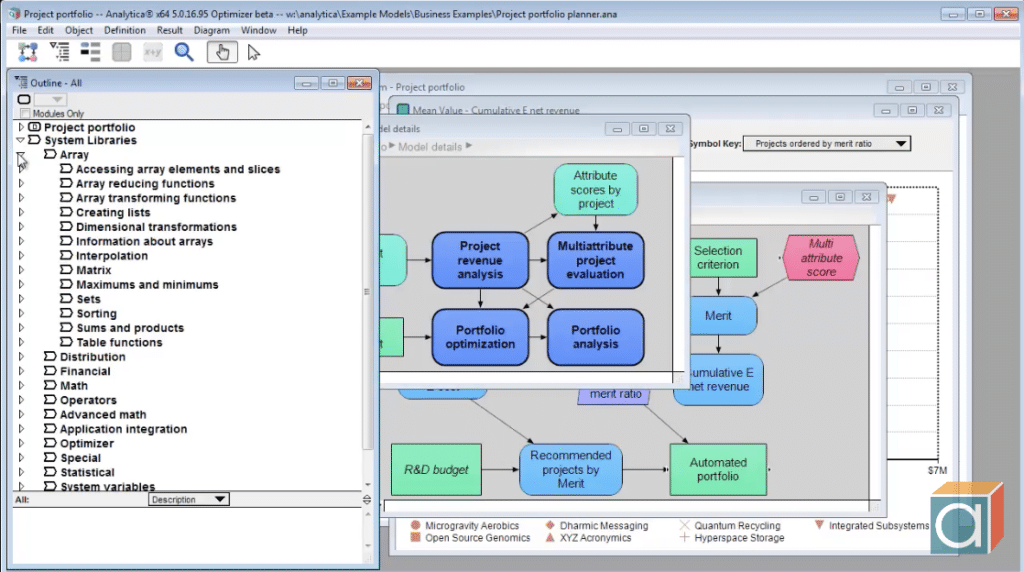
Analytica toolbar
Discover the updates to the Analytica toolbar. See what is there and how you can use it.
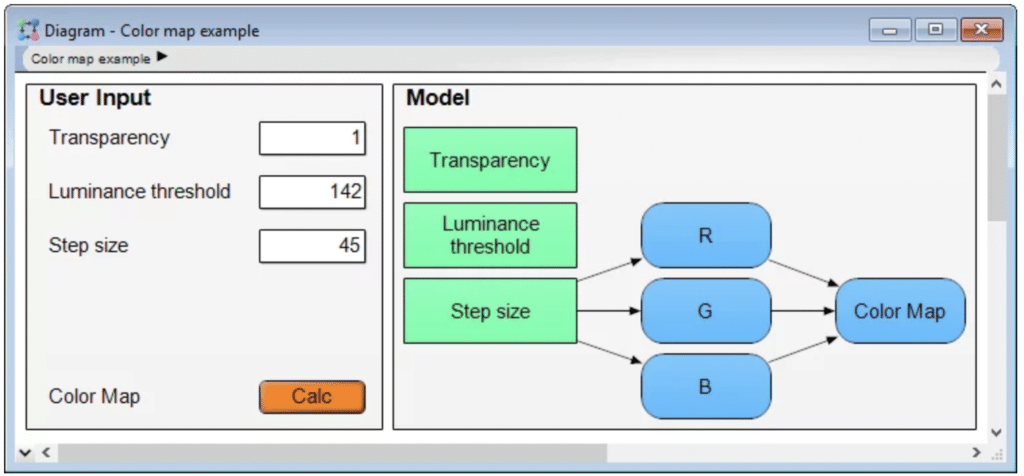
Using computed cell formatting to create a color map
In this post, I’m going to highlight some new cell formatting options. This is a new feature I’ve had fun experimenting with, and I look forward to seeing how our user community...
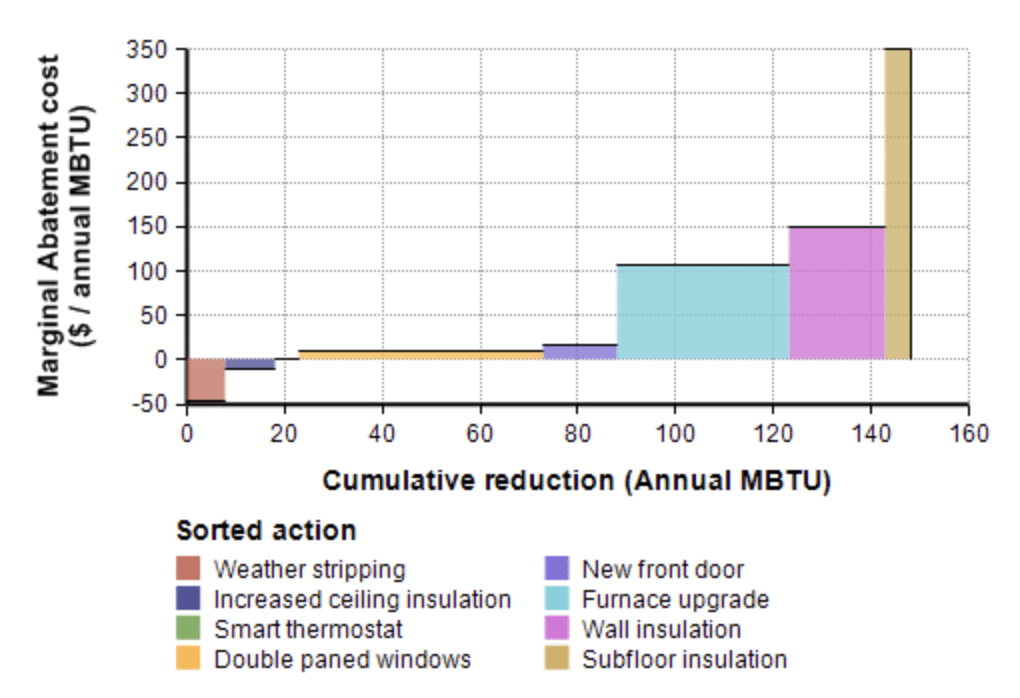
Marginal abatement: adding a dimension
In my earlier blog article, on marginal abatement, I explained what a Marginal Abatement graph is and how to set up such a graph in Analytica. In this article, I’m going to...

Cost effectiveness of installing rooftop solar panels
If you are new to modeling, it can be very helpful to watch someone build a model from start to finish. I created a model to decide whether it would be cost-effective to instal...
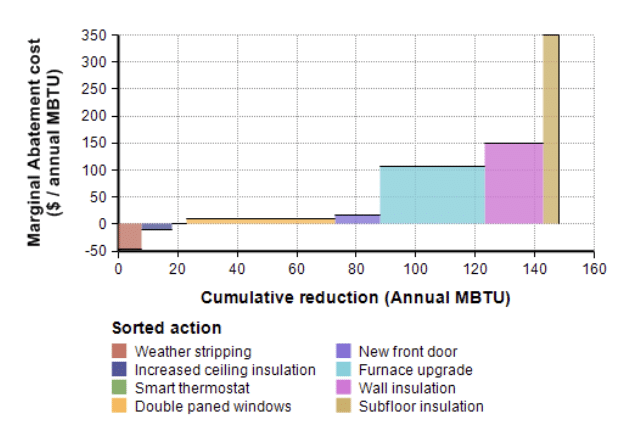
Marginal Abatement
Analytica models in the energy sector often include a Marginal Abatement graph for CO2 emissions. In this post I explain briefly what a Marginal Abatement graph is and provide...

