
Plotting over a Google Map
Here is how to display your geographic data on a Google map background.

Here is how to display your geographic data on a Google map background.

Abstract: Bayesian linear regression made super easy and intuitive! You arrive in a new city for the first time, and you’ll …
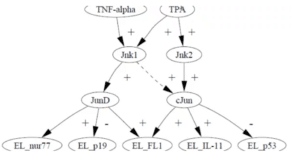
In 2002, I developed a statistical framework for testing whether your data provides statistically significant support for the hypothesis that A causes B. I published only one…
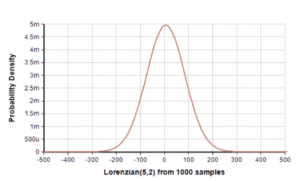
On Tuesday I had an interesting exchange with Jorge Muro Arbulú, a professor in Peru, about the Cauchy distribution, which also called the Lorenzian distribution.

A shapefile (*.shp) is a binary file format used by Geographic Information Systems (GIS). I used an existing Python library (Fiona) to read and parse a shape file, and then…
I found it pretty easy to call a Python function from Analytica using COM automation. The Component Object Model (COM) integration functionality comes included with the Analytica…
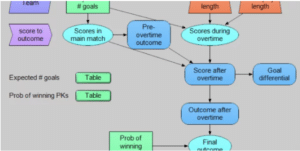
A few years ago France beat Croatia in the World Cup final. Congratulations to France for winning the last world championship! And also to Croatia for making it to the final…
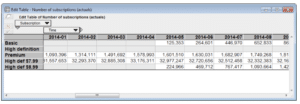
Netflix’s basic subscription plan was introduced in May 2014. In a Netflix business model that I created, I have an …