Modeling tips & tricks
Learn from our team of modeling experts and the decision analysis community on best practices for model building. Here you will find information about Analytica, as well as general tips and tricks. Topics include how to go about structuring a complex problem, how to analyze models using sensitivity and scenario analysis, and tips on selecting graphs and maps to provide clearer insights. Overall we want to guide you and your organization to be better decision makers, no matter what industry or field you work in.
For more a more comprehensive list of tutorials, user guides, videos, example models, and libraries, check out our Analytica Docs website.

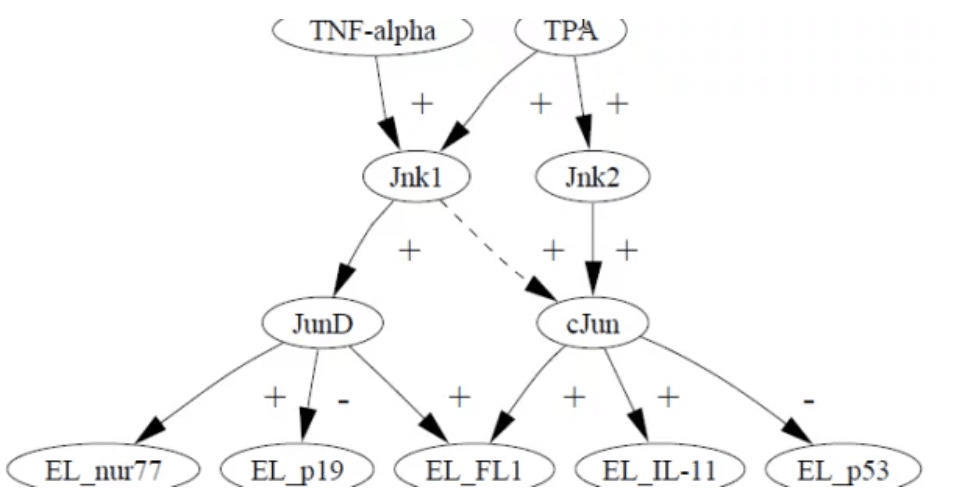
Testing hypotheses about causation
In 2002, I developed a statistical framework for testing whether your data provides statistically significant support for the hypothesis that A causes B. I published only one...

Using Python to parse a Shapefile
A shapefile (*.shp) is a binary file format used by Geographic Information Systems (GIS). I used an existing Python library (Fiona) to read and parse a shape file, and then...

How to call a Python function from Analytica
I found it pretty easy to call a Python function from Analytica using COM automation. The Component Object Model (COM) integration functionality comes included with the Analytica...

Analytica and Cognitive Radio
The more I learn about our Analytica users, the more I discover that “those who like it, like it a lot” (to borrow a slogan from a brewery back home in Canada).

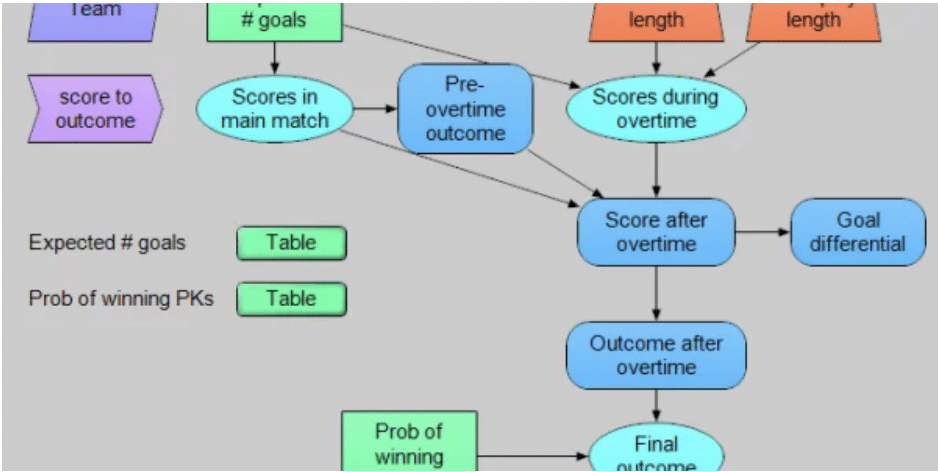
World Cup Soccer. How much does randomness determine the winner?
A few years ago France beat Croatia in the World Cup final. Congratulations to France for winning the last world championship! And also to Croatia for making it to the final...

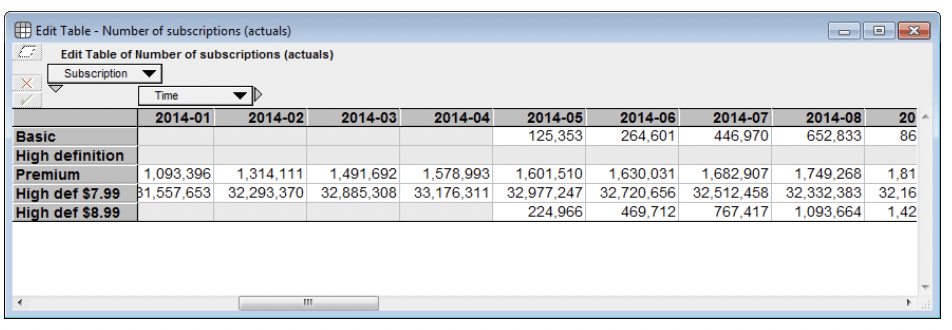
How to limit entry to specific cells of an edit table
Netflix’s basic subscription plan was introduced in May 2014. In a Netflix business model that I created, I have an …

An Analytica model that recognizes images
I had a lot of fun building and playing with an Analytica model that analyses the pixels of an image to figure out what it is an image of. It implements the resnet18 model...

Adding alternative axis scales to a graph
Starting with a graph that varies by Time in units of Seconds, I show how to configure the graph so you can quickly change the horizontal scale from Seconds to Hours, Days or...

