
Modeling tips & tricks
Learn from our team of modeling experts and the decision analysis community on best practices for model building. Here you will find information about Analytica, as well as general tips and tricks. Topics include how to go about structuring a complex problem, how to analyze models using sensitivity and scenario analysis, and tips on selecting graphs and maps to provide clearer insights. Overall we want to guide you and your organization to be better decision makers, no matter what industry or field you work in.
For more a more comprehensive list of tutorials, user guides, videos, example models, and libraries, check out our Analytica Docs website.
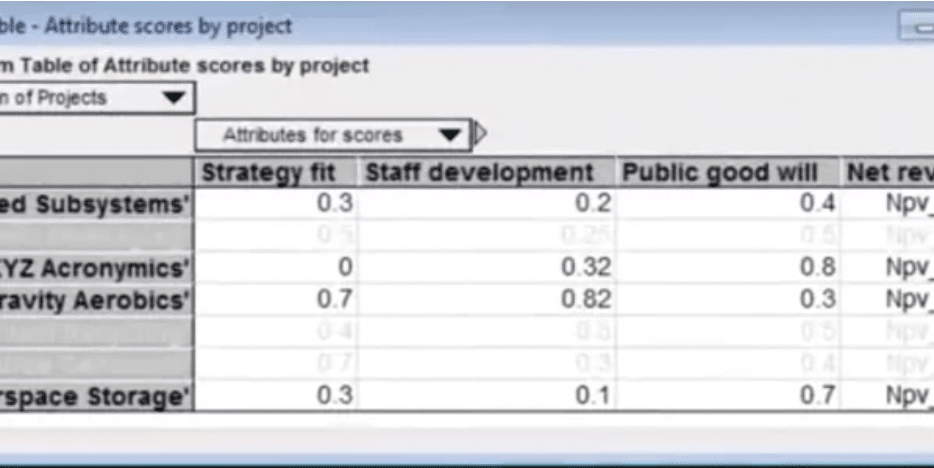
Cell formatting in DetermTable that shows which cells are active
In this Analytica 5 Video Short, I configure a DetermTable to use cell formatting so you can tell which data will be used by the computed result given the model's current...
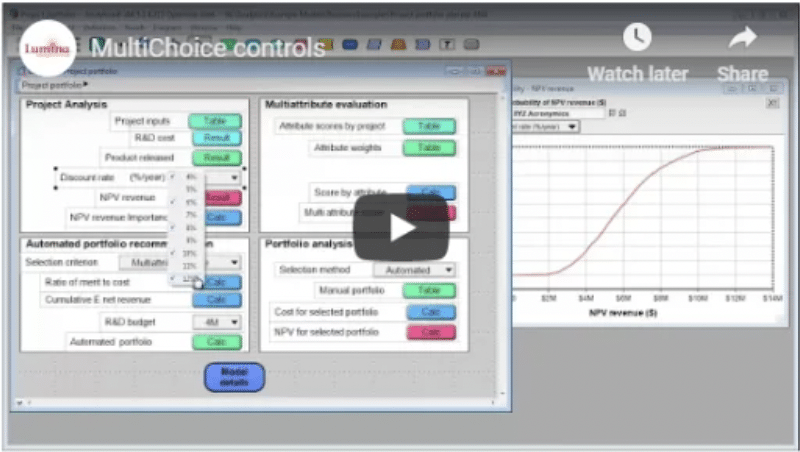
Analytica video shorts: MultiChoice controls
In this video, I showcase two uses for MultiChoice controls: For use in Selective Parametric Analysis, and for limited an index to a subset during your model's calculations.
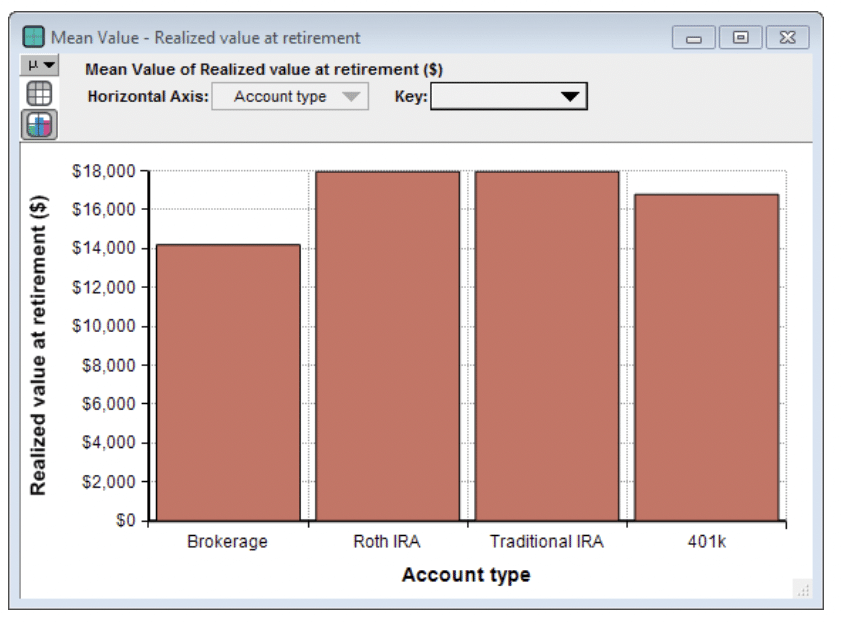
What’s the best retirement account type for me? 401(k), IRA, Roth, other?
It’s tax week here in the US, and like many other people, I have less than a week to finalize my tax returns. I also have some last minute decisions. Should I, or my wife, ...

How to simplify the IRS tax tables
The federal income tax in the United States uses a series of increasing tax brackets, so that those who earn more pay a higher percentage of their income in taxes.
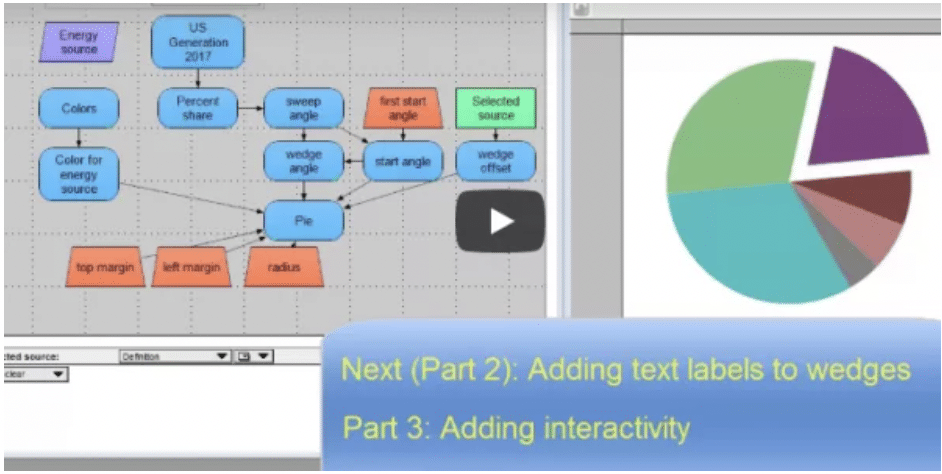
Pie charts: drawing and interacting with images
Today I’m celebrating π day with a three part series of Analytica 5 video shorts, during which I create an interactive …
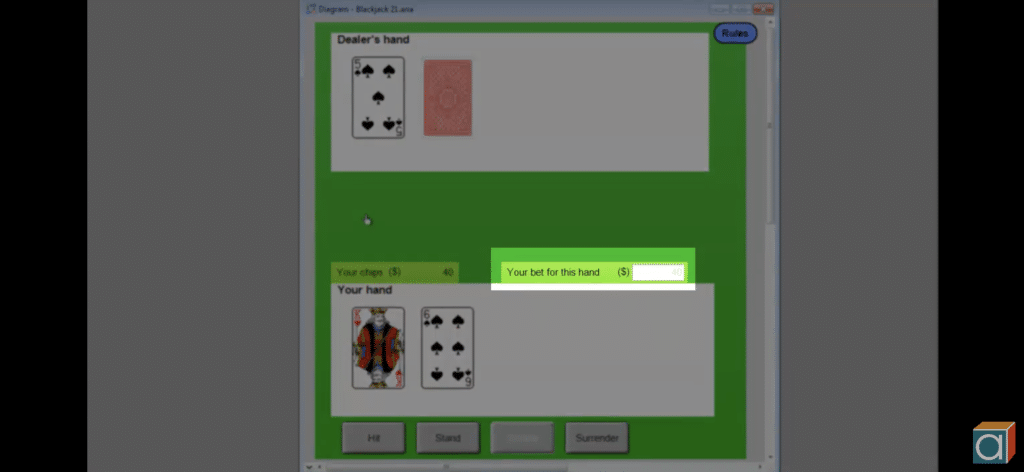
Hiding and disabling model user-interface controls
Analytica 5.0 added several features that allow you to improve your end-user interfaces that you create for your model. One of those enhancements is the ChangeNodeVisibility( )...
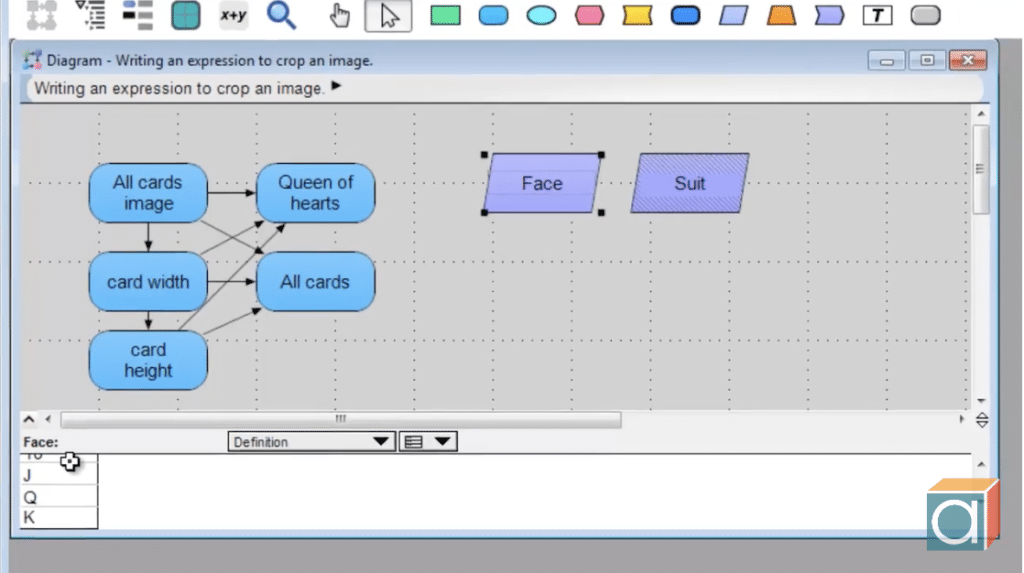
An expression to crop an image
In this video short, I create an expression that extracts a small image from a larger one. In other words, it crops the original image to a smaller rectangular region of the image...
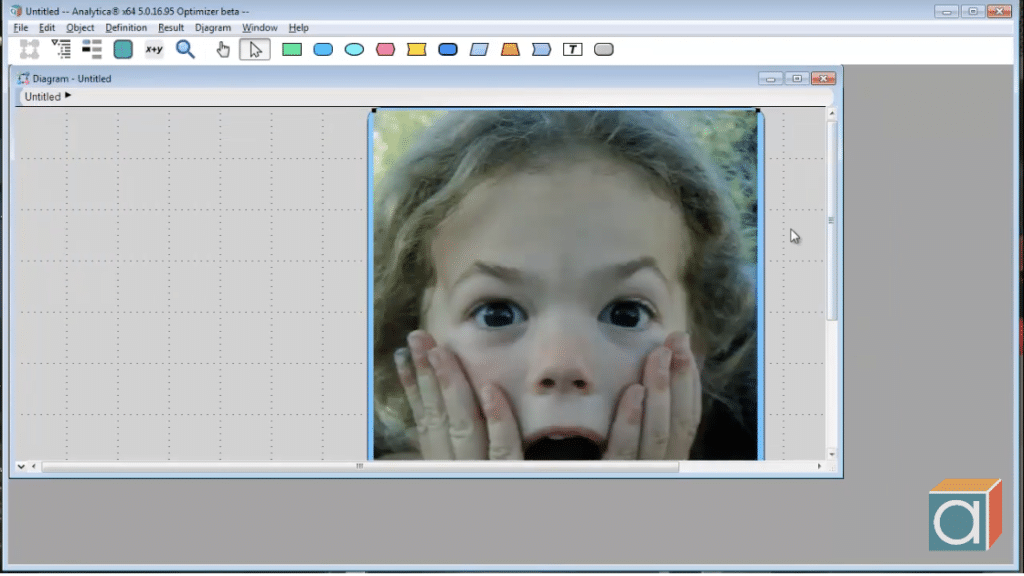
How to resize an image
This 2 minute video short shows you how to resize an image after you’ve pasted it into a diagram.

